Data Analysis & Loss Prevention
Data analysis is a process of obtaining raw data and converting it into information useful for decision-making. However with the advent of technology automatic data collection is the new norm, every click of the mouse is being used for data mining and predictive analysis, each advertisement suited to ones liking.
In today’s era of fake news and fake data – a very recent article where a Prankster fooled rating site with fake web page, fake food and fake reviews to become no 1 restaurant on one of the renowned sites (read here), it becomes difficult to ascertain authenticity of the data and this has made us all a bit skeptic.
As in any other industry, Shipping & Marine industry also uses data gathering and analysis for loss prevention exercises. P&I Clubs in general having access to large amount of data, use it for creating trends and patterns in not only identifying risk areas on board but also in determining various claim patterns and aim for its prevention. These analyses are readily available online for review.
The source of the data and benchmark used to create the data are amongst the most important factors when collating the data for analysis.
The analysis below is based on the data gathered by the author during his past years while undertaking audits/loss prevention surveys on board. It reflects data from close to 50 audits carried out by the author with about 30% representing findings from the navigational audits and remaining 70% from the navigational section of the loss prevention surveys carried out for various clients over the years.
The data being from a single auditor ensures that a same bench-marking has been used for all audits, more so important for the critical findings below.
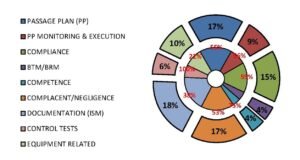
The outer circle% represents the total number of findings per each heading and the inner circle% in red denotes the % of the findings, out of them, which were deemed to be critical.
- ISM related documentation correspond to the 18% of total findings, 38% out of which were found to be critical.
- Passage Plan corresponds to 17 % of total findings, 55% out of which were found to be critical.
- Monitoring & execution of Passage Plan contributed further 9% (making a total 26 %) with 56% being critical.
- Complacency and Negligence contributed to 17% of findings, 53% of which were critical.
- Non Compliance with company SMS contributed another 15%, 55% of which were critical.
- Equipment related findings contributed another 10%, Failures in following correct Control test procedures another 6 % and 4 % each to BTM/BRM related and Competence related issues.
“Interesting Find: Even if we were to take out 10% of the equipment related findings, we have over 90% of the findings with Human element involved – If a root cause analysis for the 10% of equipment related findings would be done the number would be even more.”
“Numbers have an important story to tell. They rely on you to give them a voice” – Stephen Few
Article courtesy Capt. Hittesh Gupta